Mapping Blackjack Outcome Distributions Based on Initial Card Deal Patterns in Live Dealer Formats
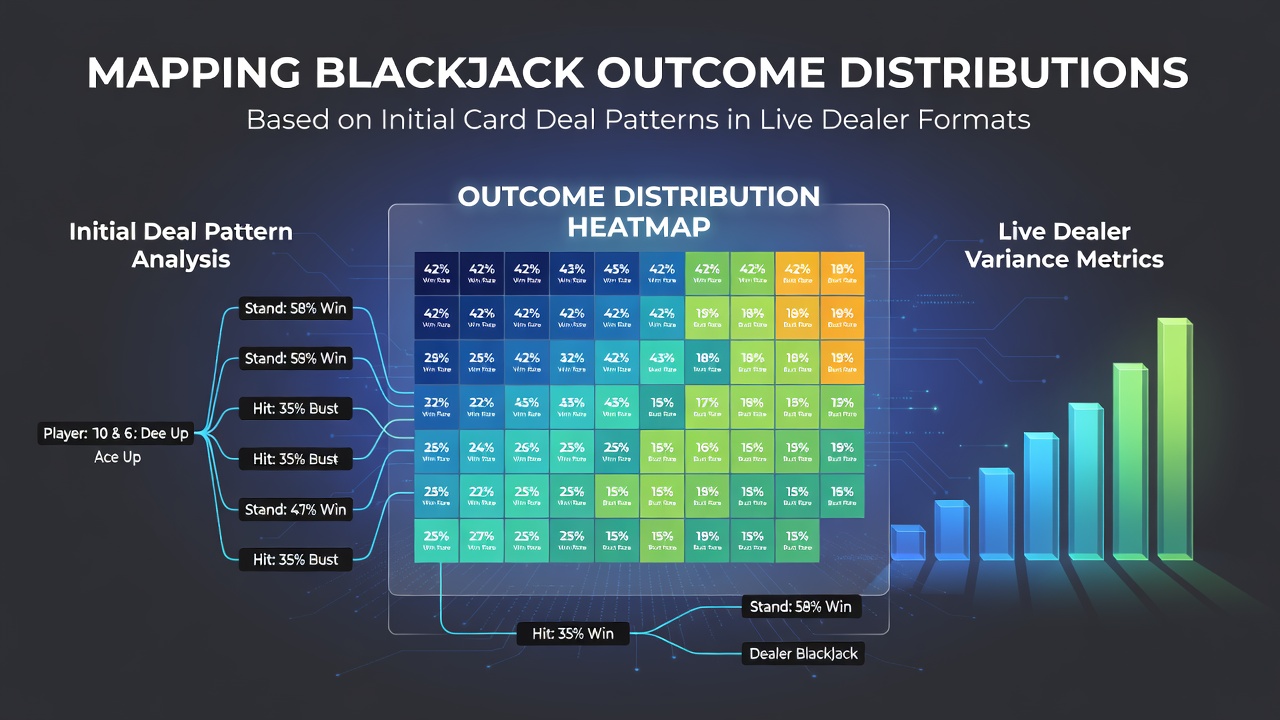 Analysts track how the first two cards dealt shape final results across thousands of live dealer rounds, and they build distribution maps that connect those opening patterns to win rates, push frequencies, and loss percentages. Researchers compile data from physical decks shuffled on camera, then they record every subsequent draw to isolate the influence of starting combinations such as hard totals, soft totals, and pairs. These maps reveal clusters where certain initial deals lead to narrow outcome ranges while others spread across wider probability bands because later cards interact differently with each base hand. Live dealer platforms stream real-time footage of cards landing on felt, which allows precise logging of every initial pair without relying on random number generators. Operators capture the exact sequence from the shoe or continuous shuffler, then they feed the information into statistical models that calculate conditional probabilities for each possible final total. Studies show that initial deals totaling 11 or less produce broader outcome distributions because multiple hit paths remain open, whereas starting totals of 19 or 20 compress the distribution toward immediate stand decisions with higher push or win likelihoods.
Tracking Pattern Frequencies in Real-Time Streams
Dealers follow standard procedures that place the first card to each player position followed by the dealer upcard, after which the second player card completes the initial pattern. Observers note that pairs appear at predictable rates across extended sessions, and software records whether those pairs receive splits that further alter downstream distributions. Data collected through June 2026 from regulated studios in multiple jurisdictions indicates that ace-ten combinations surface at rates consistent with combinatorial expectations, yet the subsequent dealer draw sequences create distinct clusters of final outcomes visible only when mapped against each opening pattern.
Statistical Models and Conditional Probabilities
Mathematicians apply combinatorial enumeration to every possible remaining deck composition after the initial deal, then they generate probability trees that branch into win, lose, or push categories. These models incorporate multi-deck penetration levels typical of live dealer formats, and they adjust for rules such as dealer hit or stand on soft 17. Figures from industry reports reveal that initial hard 16 distributions lean heavily toward loss when the dealer shows a high upcard, while the same total against a low upcard shifts the outcome spread toward more frequent pushes after additional cards arrive.
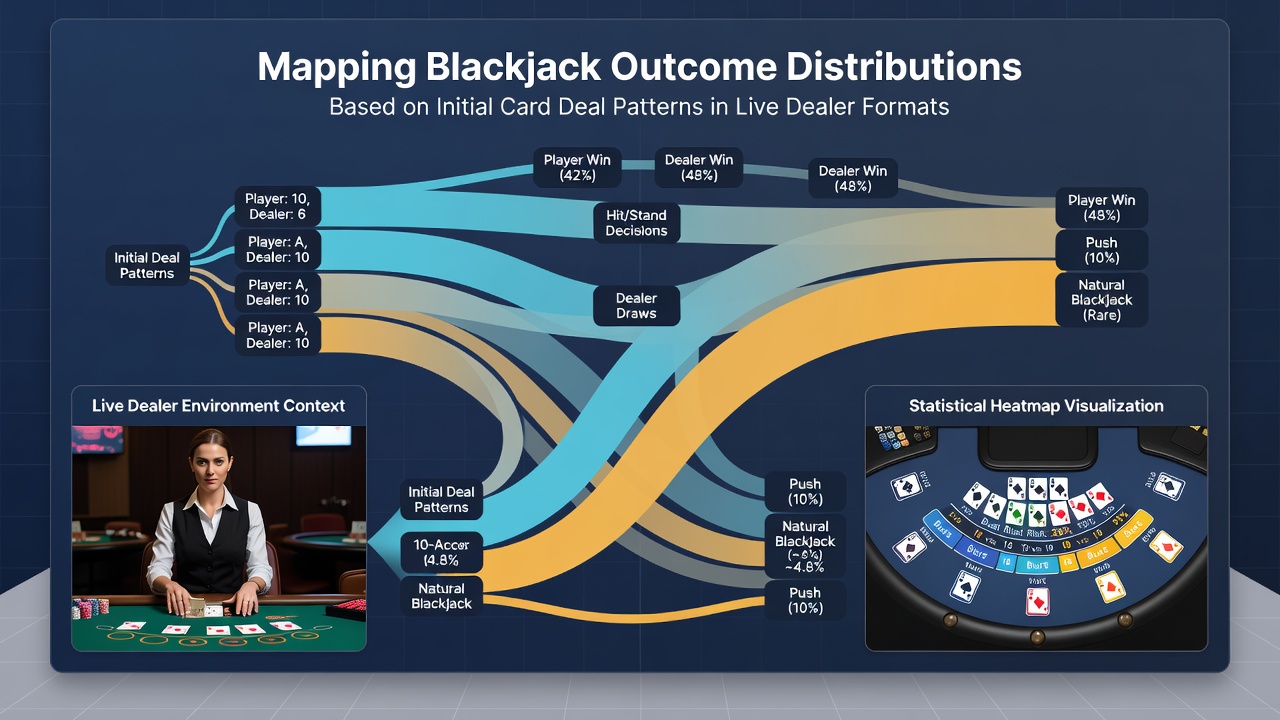 Software tools overlay these curves on live feeds so floor supervisors can monitor deviations from expected distributions during high-volume periods. One study released by the University of Nevada, Las Vegas gaming research center examined more than 2.4 million live dealer hands and isolated the effect of initial soft totals on final results. The analysis demonstrated that soft 18 starting patterns produce outcome distributions with elevated push rates compared with hard 18 equivalents because the ace flexibility allows additional hit decisions without immediate bust risk.
Regional Regulatory Data and Cross-Market Comparisons
Regulators in New Jersey and the Australian Capital Territory require operators to retain detailed hand histories that support independent audits of outcome distributions. These records allow researchers to compare live dealer patterns across different deck sizes and shuffle frequencies, and they highlight how initial deal clustering affects long-term return-to-player calculations. Industry associations such as the European Casino Association publish aggregated summaries that show consistent mapping trends despite variations in table rules between markets.
Practical Applications for Session Monitoring
Casino analysts use the mapped distributions to set automated alerts when observed frequencies drift outside historical bands for specific initial patterns. Such monitoring helps maintain game integrity while providing transparent records for compliance reviews. Players who review public summaries from these audits gain clearer pictures of how their opening hands align with broader statistical expectations in live dealer environments.
Conclusion
Mapping exercises continue to refine the connections between initial card patterns and final outcome spreads in live dealer blackjack. Updated datasets through June 2026 strengthen the precision of these models and support ongoing regulatory oversight across international markets. The resulting distributions offer a factual baseline that operators and researchers apply when evaluating table performance and rule variations.